8 Charts That Illustrate the Impact of Food Systems and Our Diets on Climate Change
There is a massive gap between climate change and the impact our diet and food system has on it, both in terms of public and private investment and media coverage. Here are eight statistical charts that highlight just how much our food habits and agricultural systems are linked to the climate crisis.
The food we eat, how it’s grown, where it comes from, the resources required – all this plays a major role in how we as humans contribute to climate change. There are lots of myths and misconceptions when it comes to the impact of our dietary habits – many perpetuated by meat and dairy lobby groups.
The impact of animal agriculture is vast and damning. Reports show that we can avoid 100 gigatons of emissions if three-quarters of people adopt plant-rich diets by 2050, and that veganism can reduce emissions by 75% compared to meat- and dairy-heavy diets.
But for those who like to see the pure numbers and statistics, we compiled eight fact-based charts from Our World in Data – credited to deputy editor and science outreach lead Hannah Ritchie (someone to follow if you don’t already) – explaining the true impact of food on the climate crisis.
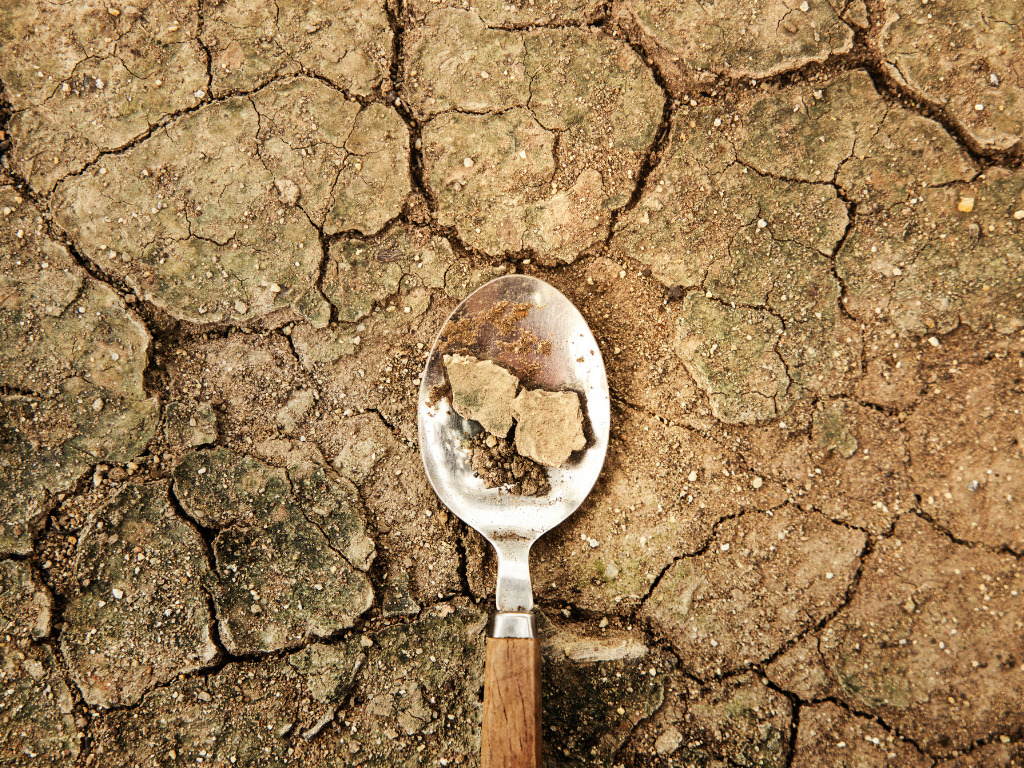
1. Greenhouse gas emissions across the food supply chain
Taken from Joseph Poore and Thomas Nemecek’s landmark 2018 study, this graph shows that beef (from beef herd cows) has the highest climate footprint of any food (99kg of CO2 equivalent), owing to methane emissions from cows and land conversion for grazing and animal feed.
In terms of land use change, however, dark chocolate has the highest greenhouse (GHG) gas emissions – it also comes second on the overall list. But most plant-based products, like fruits and vegetables, have 10 to 50 times lower emissions than most animal-based foods, due to transport distance, farming methods, storage and packaging.
Nuts, meanwhile, have a negative land use change figure because nut trees are currently replacing croplands, and carbon is stored in these trees.
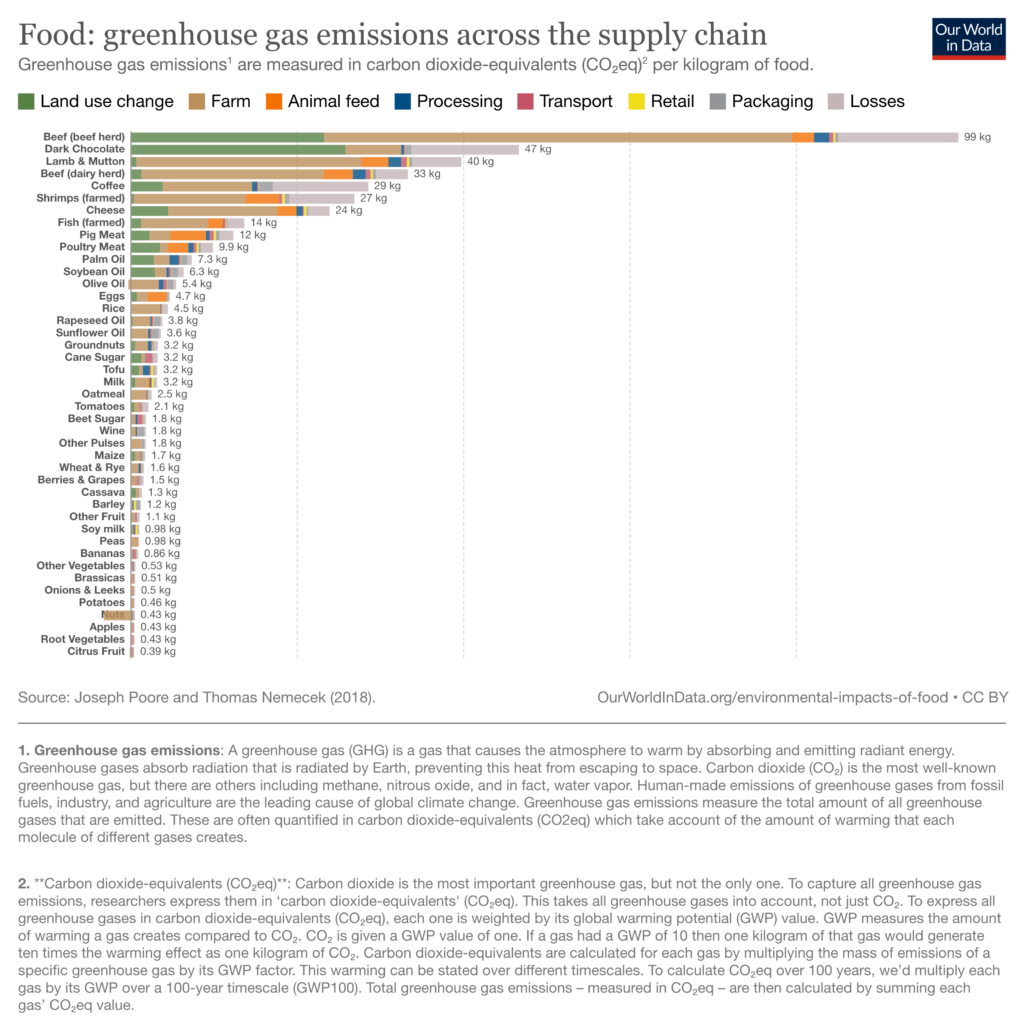
2. Greenhouse gas emissions per 1,000 kcal
In terms of GHG emissions per 1,000 kilocalories, coffee tops the list at 50.95kg of CO2e, followed by beef from beef herd cows (36.44kg), prawns (26.09kg), lamb and mutton (12.53kg), and beef from dairy cows (12.2kg). Interestingly, tomatoes, which were middle of the total GHG list, come fifth, at 11kg of CO2e per 1,000 kcal.
But once again, most fruits, vegetables, pulses and nuts are low on this list – with all having 12 to 50 times lower emissions than beef from beef herd cows (except for tomatoes).
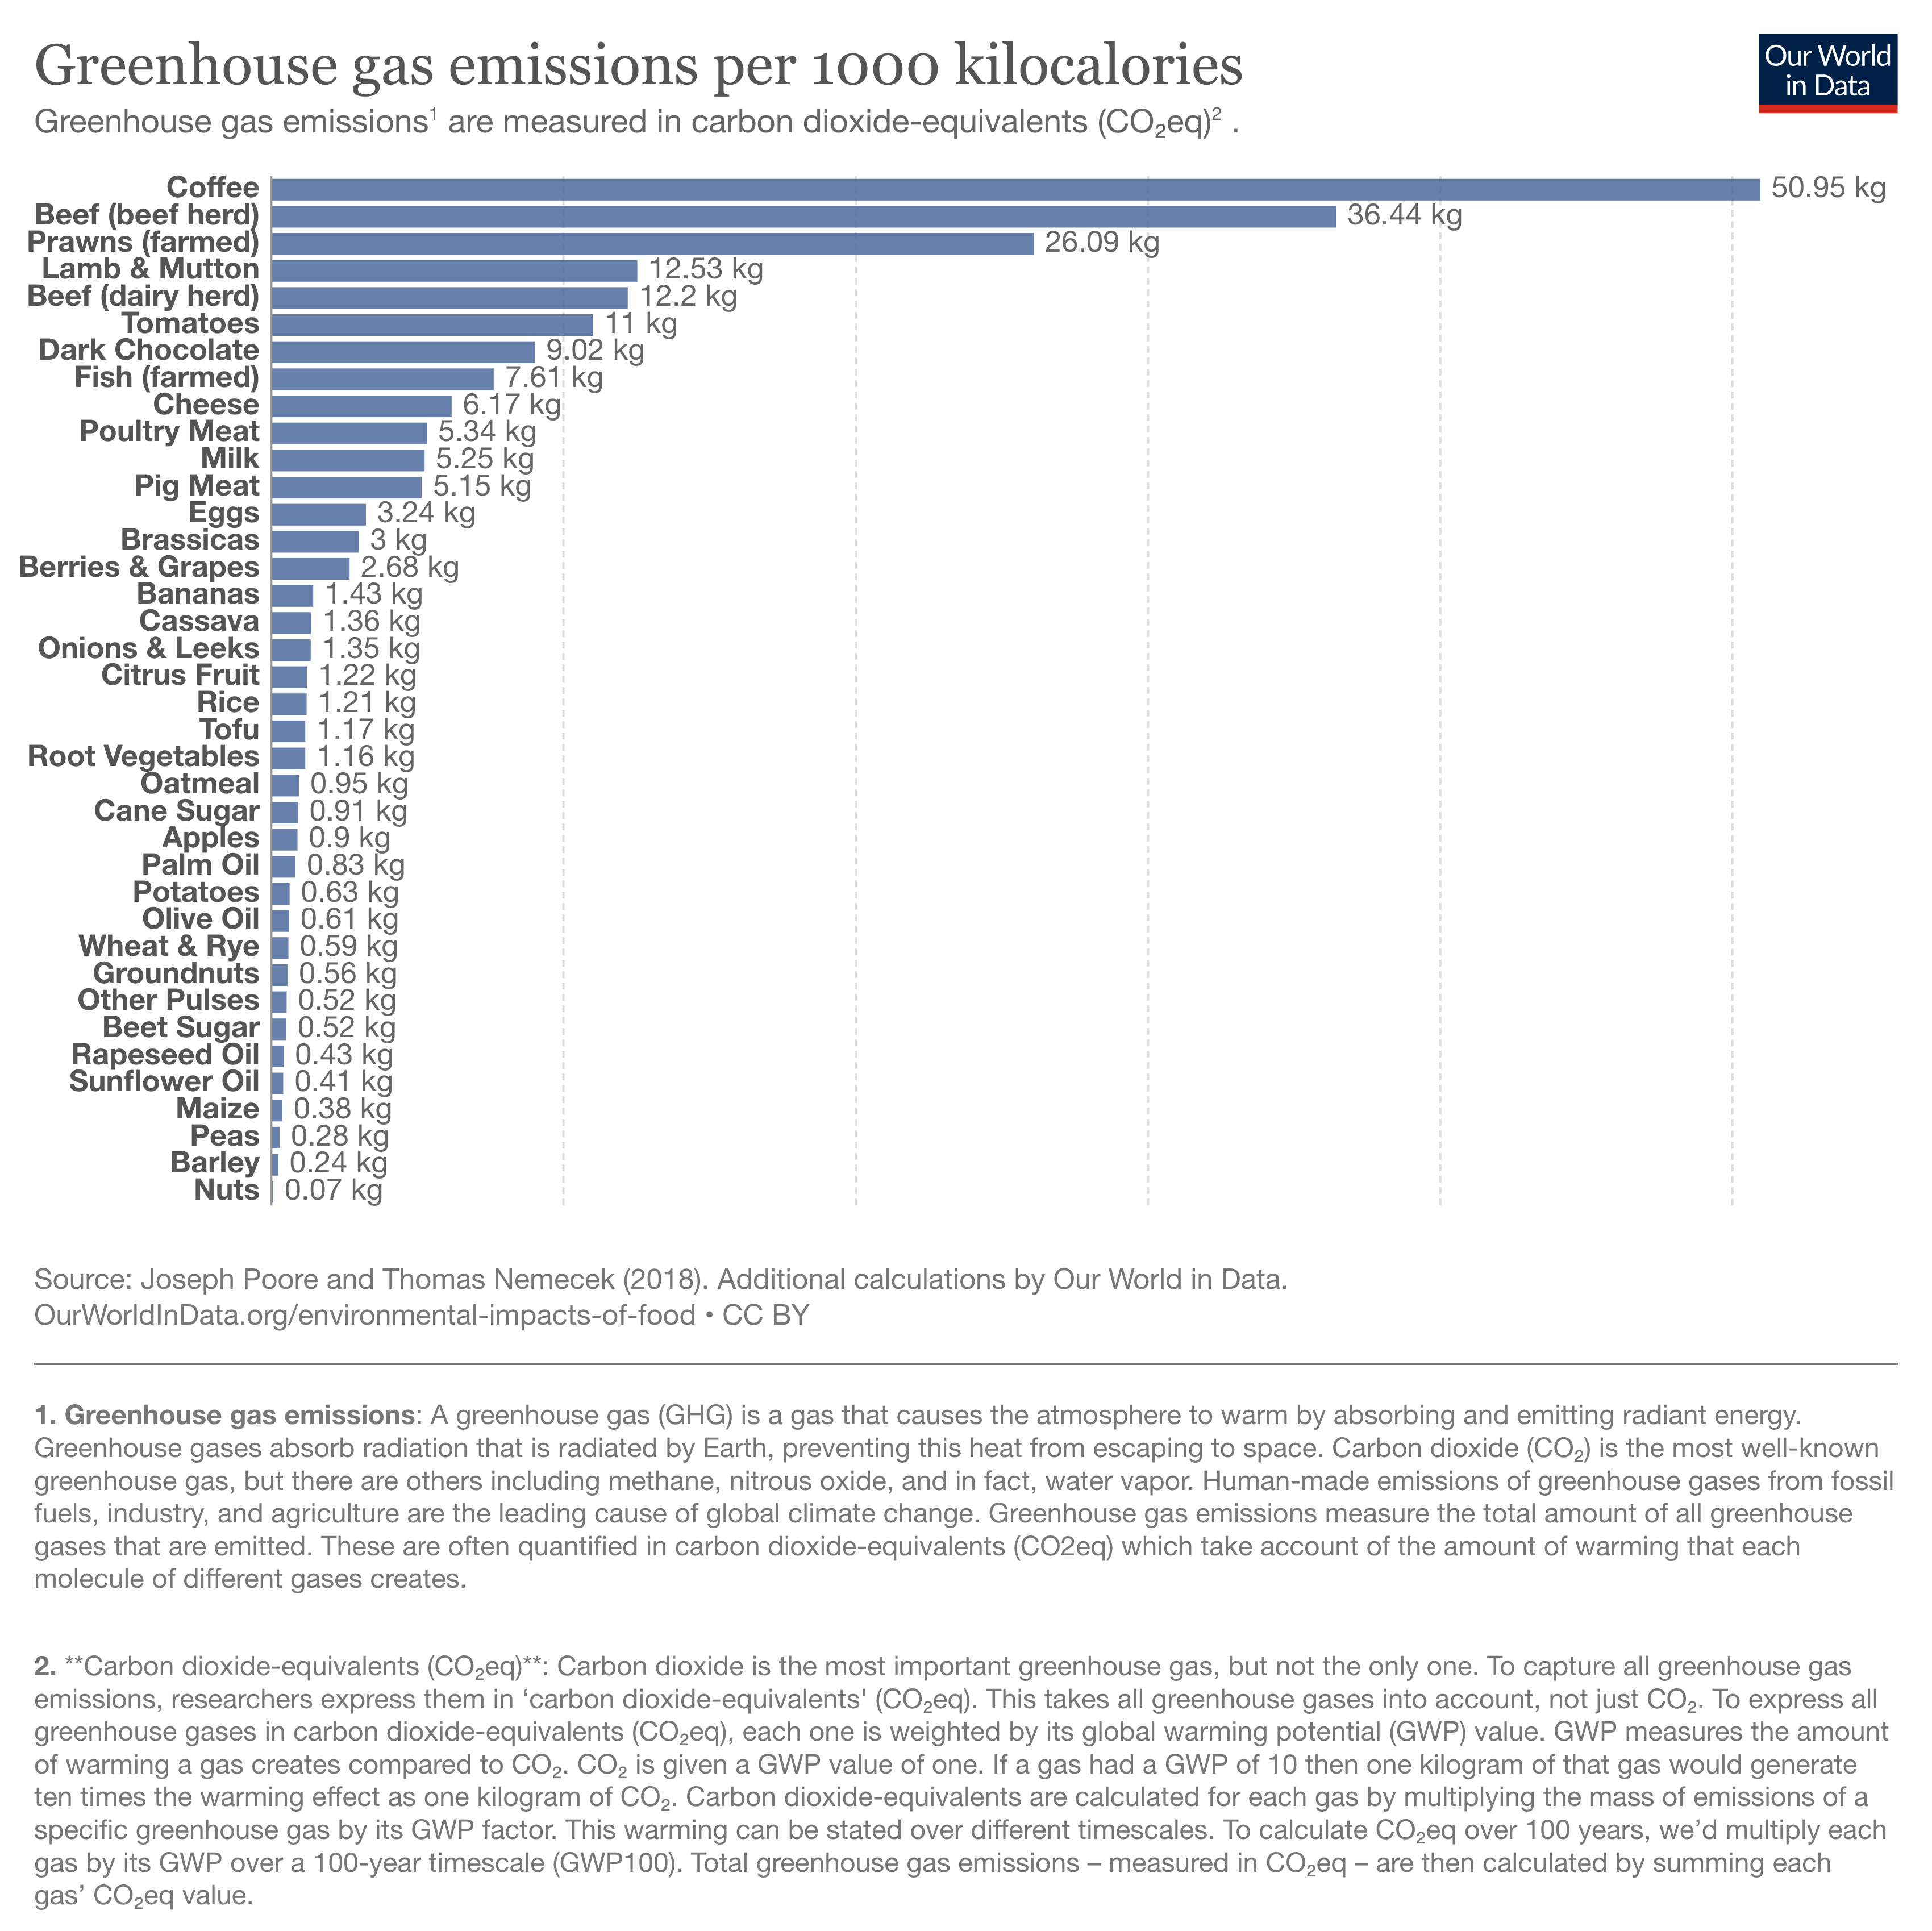
3. Environmental footprint of dairy and plant-based milk
Dairy has by far a higher carbon footprint than any plant-based milk alternative. In terms of land use, cow’s milk uses 8.95 sq m of land per litre – over 11 times higher than the next on the list, oat milk. Dairy also uses 628 litres of water for one litre of milk (almond milk, at 371.5 litres, is next), and emits 3.15kg of CO2e, nearly three times as much as rice (1.18kg).
In terms of the dairy alternatives, rice milk uses the least land (0.34 sq m), but has the highest emissions. And while almond milk has the lowest emissions, it uses the most water (soy milk uses the least).
4. Scarcity-weighted water use per kg of food
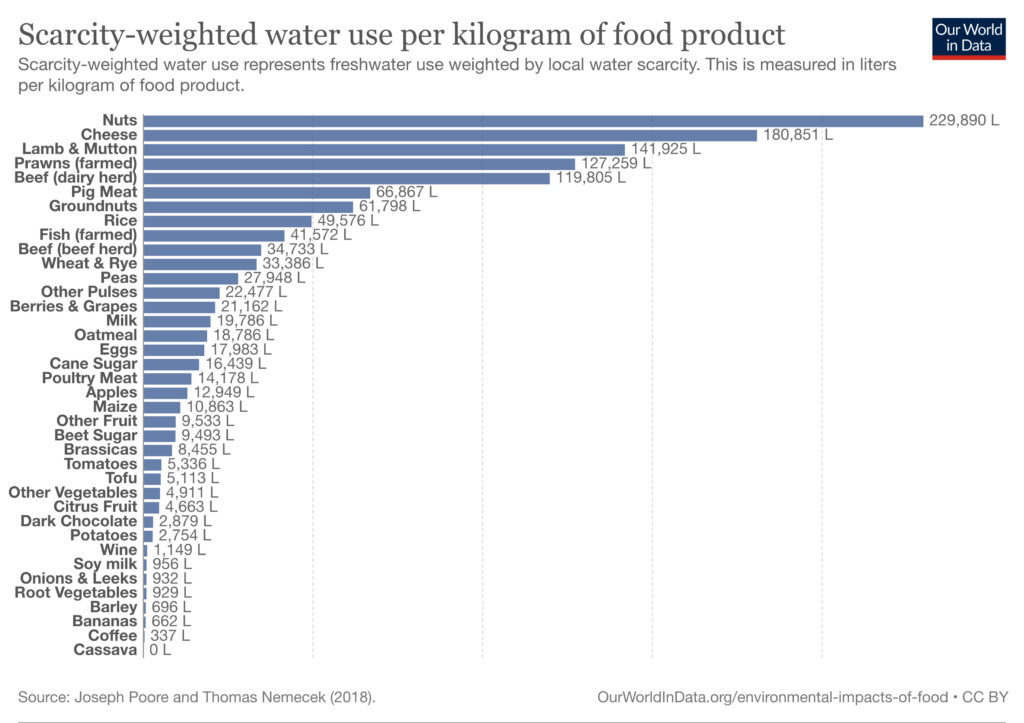
While nuts have a carbon-negative land use figure, they have the highest amount of freshwater used (nearly 230,000 litres), when weighted against local water scarcity in the regions they’re grown in. This is followed by cheese (180,850 litres). Since nuts are widely used in vegan cheese products too, cheese production in general doesn’t bode well for water scarcity.
These two food products are followed by meat, seafood and peanuts. While dark chocolate is one of the highest-emitting foods on the supply chain, its scarcity-weighted water use is among the lowest – similar differences exist for coffee.
5. Carbon opportunity costs per kg of food
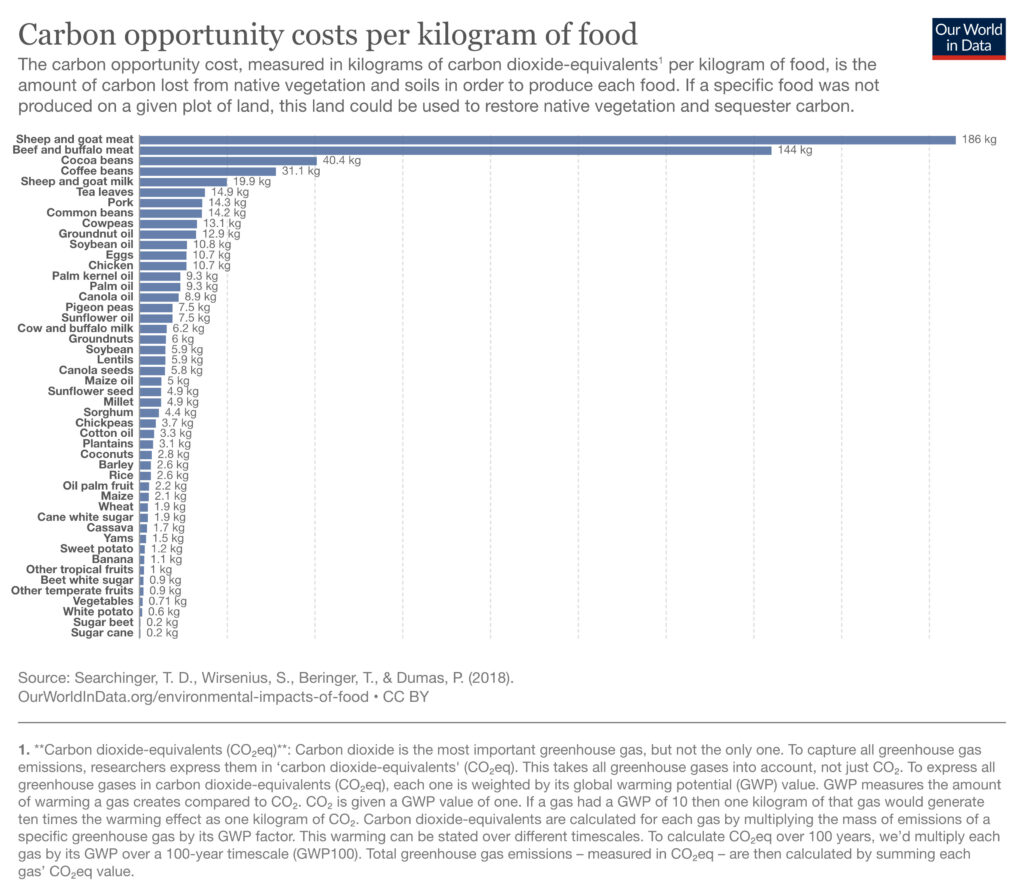
Our World in Data describes carbon opportunity costs as “the amount of carbon lost from native vegetation and soils in order to produce each food”, adding that “if a specific food was not produced on a given plot of land, this land could be used to restore native vegetation and sequester carbon”.
Sheep and goat meat tops the list with 186kg of CO2e per kg of meat lost, followed by beef and buffalo meat at 144kg. This is followed by cocoa and coffee beans. Sugar canes, sugar beets and white potatoes are at the bottom of the list, with the lowest carbon opportunity cost.
6. Land use for food production
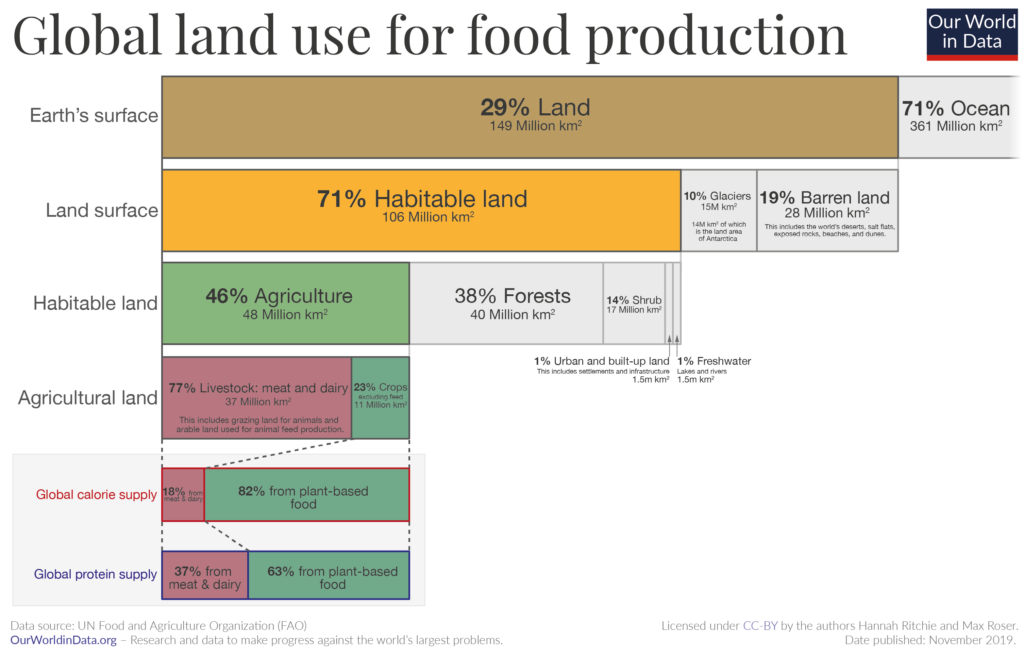
About half (46%) of the world’s land is used for agriculture, which includes the land used for pasture grazing and cropland used for animal feed and direct human consumption. But there is a massive gap between the uses.
Over three-quarters (77%) of agricultural land is used for livestock (pasture grazing and animal feed), which produces only 18% of the world’s calories and 37% of its protein. In contrast, the 23% of land used for crops for human consumption – plant-based food – contributes to 82% of calories and 63% of proteins globally. In short, more land is used for a practice that produces much smaller amounts of food for humans.
7. Food emissions could consume most of our carbon budget
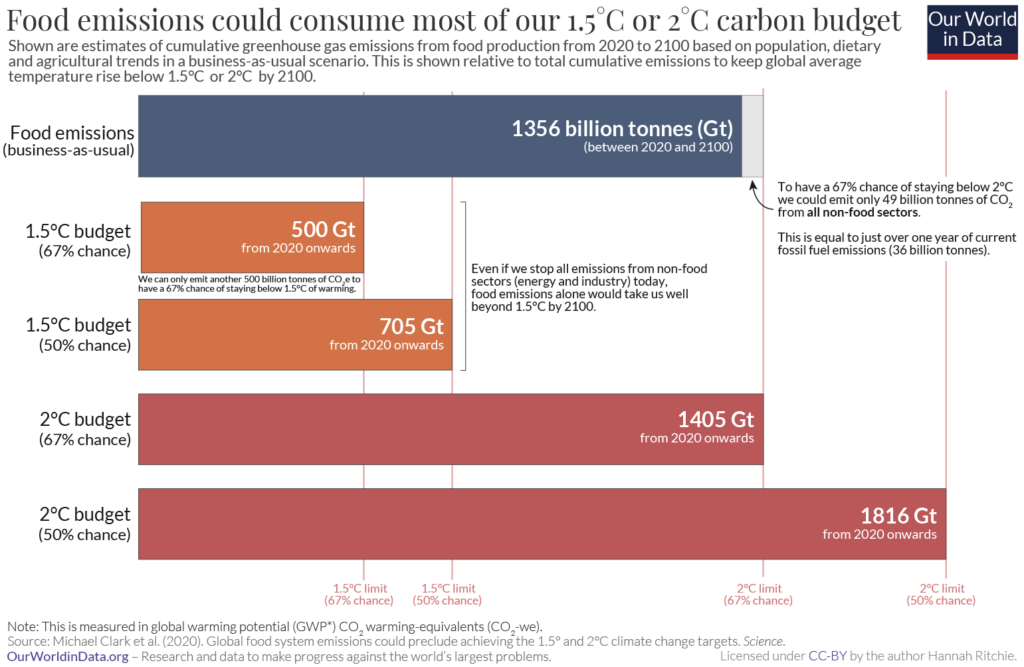
In a business-as-usual scenario, the world will emit around 1,356 billion tonnes of CO2e by 2100. This would take us well beyond the 1.5°C global heating limit outlined in the 2015 Paris Agreement. To have a 67% chance of staying below this range, we can only emit 500 billion tonnes of CO2e, which increases to 705 billion tonnes for a 50% chance.
In fact, even if we stop all emissions from non-food sectors (energy and industry), food emissions alone will surpass the 1.5°C carbon budget. To have a 67% chance of staying below the 2°C temperature rise above pre-industrial levels, we can only emit 49 billion tonnes of CO2e from all non-food sectors – that equates to just over a year of current fossil fuel emissions.
8. Food and agriculture systems account for 25-35% of global GHG emissions
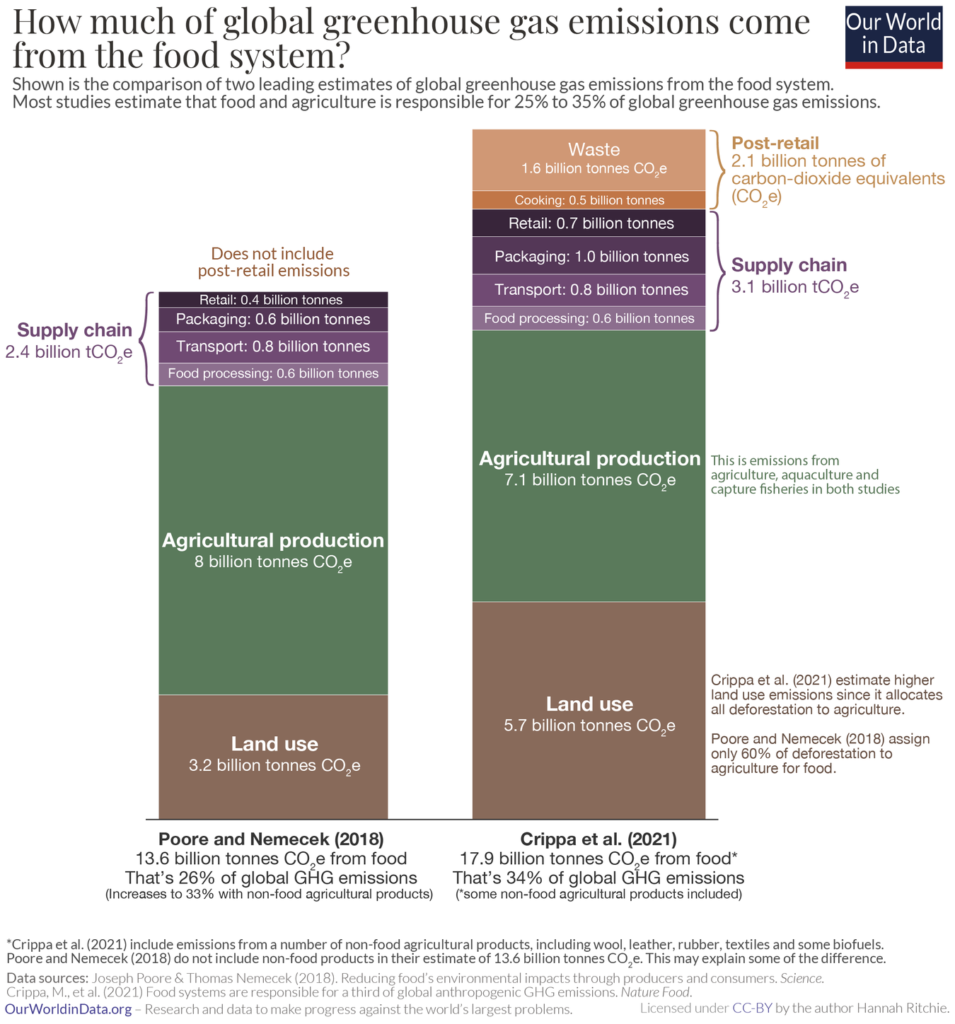
There are multiple estimates calculating food’s share of global emissions. The Intergovernmental Panel on Climate Change reports a range from 10.8 and 19.1 billion tonnes of CO2e – that’s between 21-37% of total emissions.
Poore and Nemecek estimate that number at 26%, while a 2021 study in the Nature Food journal by Monica Crippa and colleagues says it’s actually 34%. Our World in Data’s Ritchie attributes this contrast to a difference in methodologies. Poore and Nemecek only quantify emissions up to the retail stage, not including consumer cooking and waste. They also assign only 60% of deforestation to food agriculture, while Crippa et al allocate all of it to food.
The other difference is that Poore and Nemecek only include food products in their estimate, and exclude non-food products like cotton, wool, leather, rubber and biofuels. Crippe et al include some of these. And when the former due does account for these products, the estimate goes up to 33% – a much smaller difference.
All in all, as Ritchie puts it: “If someone asks me [about total food emissions], my response is usually: ‘Around 25% to 30% from food. Around one-third if we include all agricultural products.'”