Report Details Historical and Present-Day Per Capita Emissions by Country
Data released last May from the World Resources Institute platform Climate Watch reveals insights into countries’ historical and present-day per capita emissions.
Among the top ten emitters, according to the report, the United States and Russia have the highest per capita emissions, while India’s per capita emissions are the lowest at just 2.5 tCO2e per person. However, there have been reductions in per capita emissions for the U.S., Russia, Japan, and the E.U., the data revealed. In particular, the E.U. has achieved a 29 percent reduction since 1990, placing it at number 8 with 7.04 tCO2e per person.
The findings
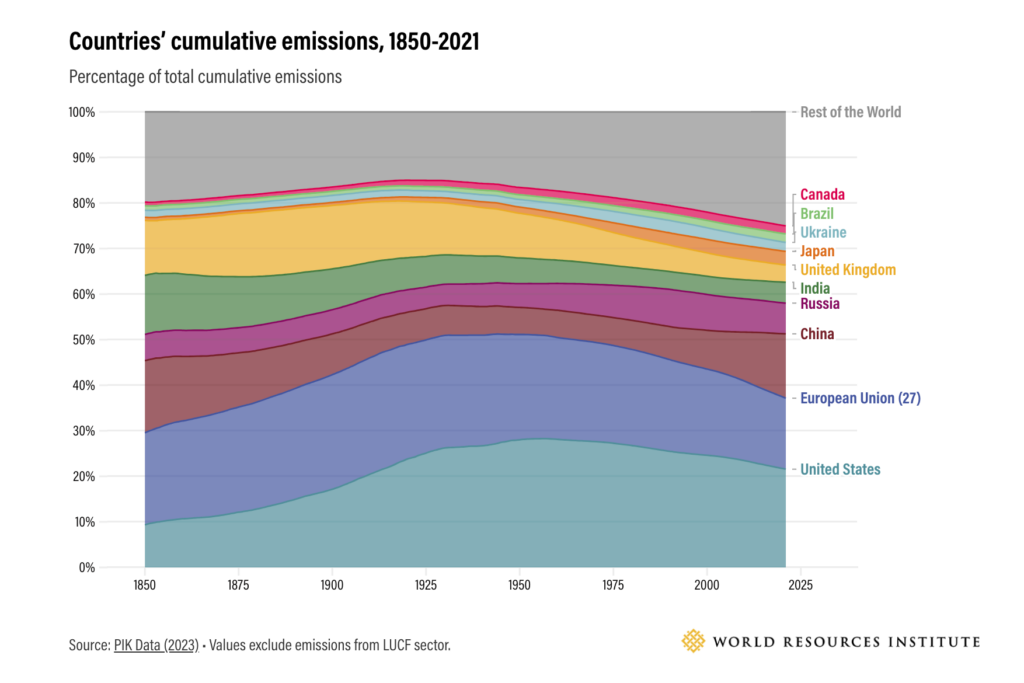
Historically, the U.S. and E.U. have contributed the most cumulative emissions globally, with the responsibility becoming even greater when considering historical emissions per capita.
The report says that in order to address climate change effectively, the decoupling of emissions from economic development is crucial. Developed countries must accelerate emission reduction efforts and support developing nations in transitioning to low-emissions economies by providing financial and technological assistance.
Per capita emissions are influenced by economic and technological factors, declining with the adoption of lower-carbon technologies and changes in energy consumption patterns. Advanced economies like the U.S., E.U., and Japan have reduced per capita emissions through the deployment of renewable energy sources and the transition away from high-emitting fossil fuels.
Emerging economies, on the other hand, have experienced increasing per capita emissions, except for Sub-Saharan Africa, which has seen a decline. Economic growth and reliance on carbon-intensive fuels are the primary drivers behind the rise in emissions in these regions.
Countries with the highest per capita emissions often have emissions-intensive industries or significant land-use change emissions. Qatar, Bahrain, and Kuwait rely on emissions-intense industries such as oil and gas production, while the Solomon Islands and Botswana have large emissions from land-use changes including a rise in deforestation.
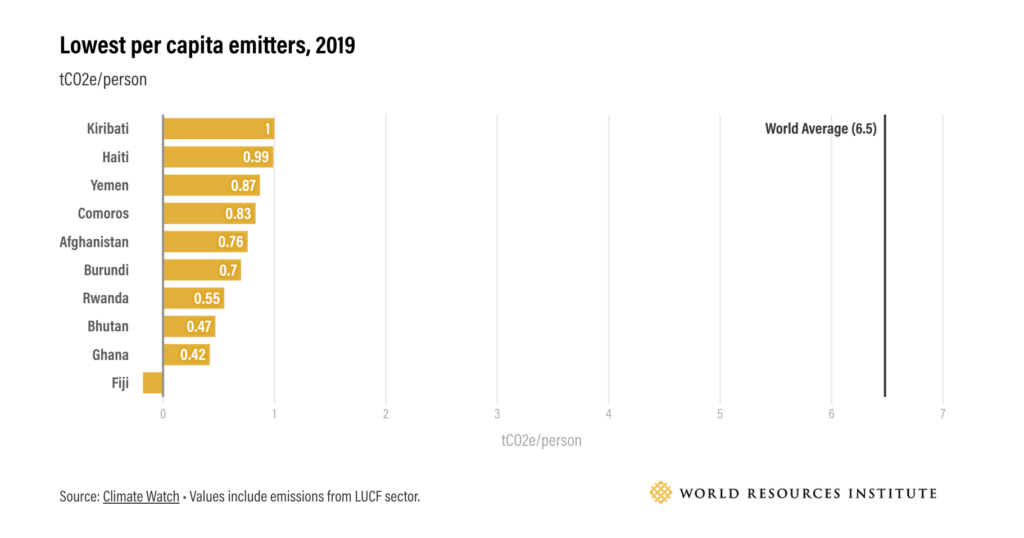
Developing nations with smaller economies generally have lower per capita emissions. Out of the 50 lowest per capita emitters, 45 are lower-income countries with emissions values a fourth of the world average.
The path toward emissions reductions
Earlier this month, a report published by the Committee for Economic Development (CED), the public policy center of The Conference Board, said the path forward for the U.S. to meet its net-zero emissions targets by 2050 includes stronger partnerships between government and industries. “The U.S. business and policy communities [need to] work hand in hand,” said Dr. Lori Esposito Murray, President of CED.
“Climate change is a defining and urgent 21st-century global challenge which threatens global security, economic prosperity, environmental sustainability, and public health,” Esposito said. “Along with the other largest GHG emitters, the U.S. must set the right path to net zero and position itself as a leader in a greener global economy.”